Tiddlywiki with TiddlyMap: As personal Knowledge Graph tool

TiddlyWiki is a non-linear, personal web notebook that anyone can use for capturing, organizing, and sharing complex information. It’s a single HTML file containing JavaScript, CSS, and the content. This makes it incredibly portable and easy to use, aligning well with modern needs for data privacy and control.
TiddlyWiki is unique representative of self hosting and self extending app . So it is a HTML file that write a new information to itself. It is allow you to create a portable wikipedia or now full scale Personal Knowledge Graphs in a visual form.
Why TiddlyWiki?
- Portability: Being a single HTML file, it can be easily moved, backed up, and shared.
- Customizability: With its rich set of plugins and themes, you can tailor it to your needs.
- Privacy: Your data stays on your device unless you decide to share it, making it a good fit for those concerned about data privacy.
- Open Source: Given that it’s open-source, it aligns well with the ethos of self-sovereign identity (SSI), a concept you’re keen on.
Core Features
Tiddlers: The basic unit of information in TiddlyWiki. They can contain text, images, or even code. Tags: Allows for easy categorization and retrieval of tiddlers. Filters: Advanced search and sorting capabilities. Widgets and Macros: Extend functionality and automate repetitive tasks.
What is TiddlyMap?
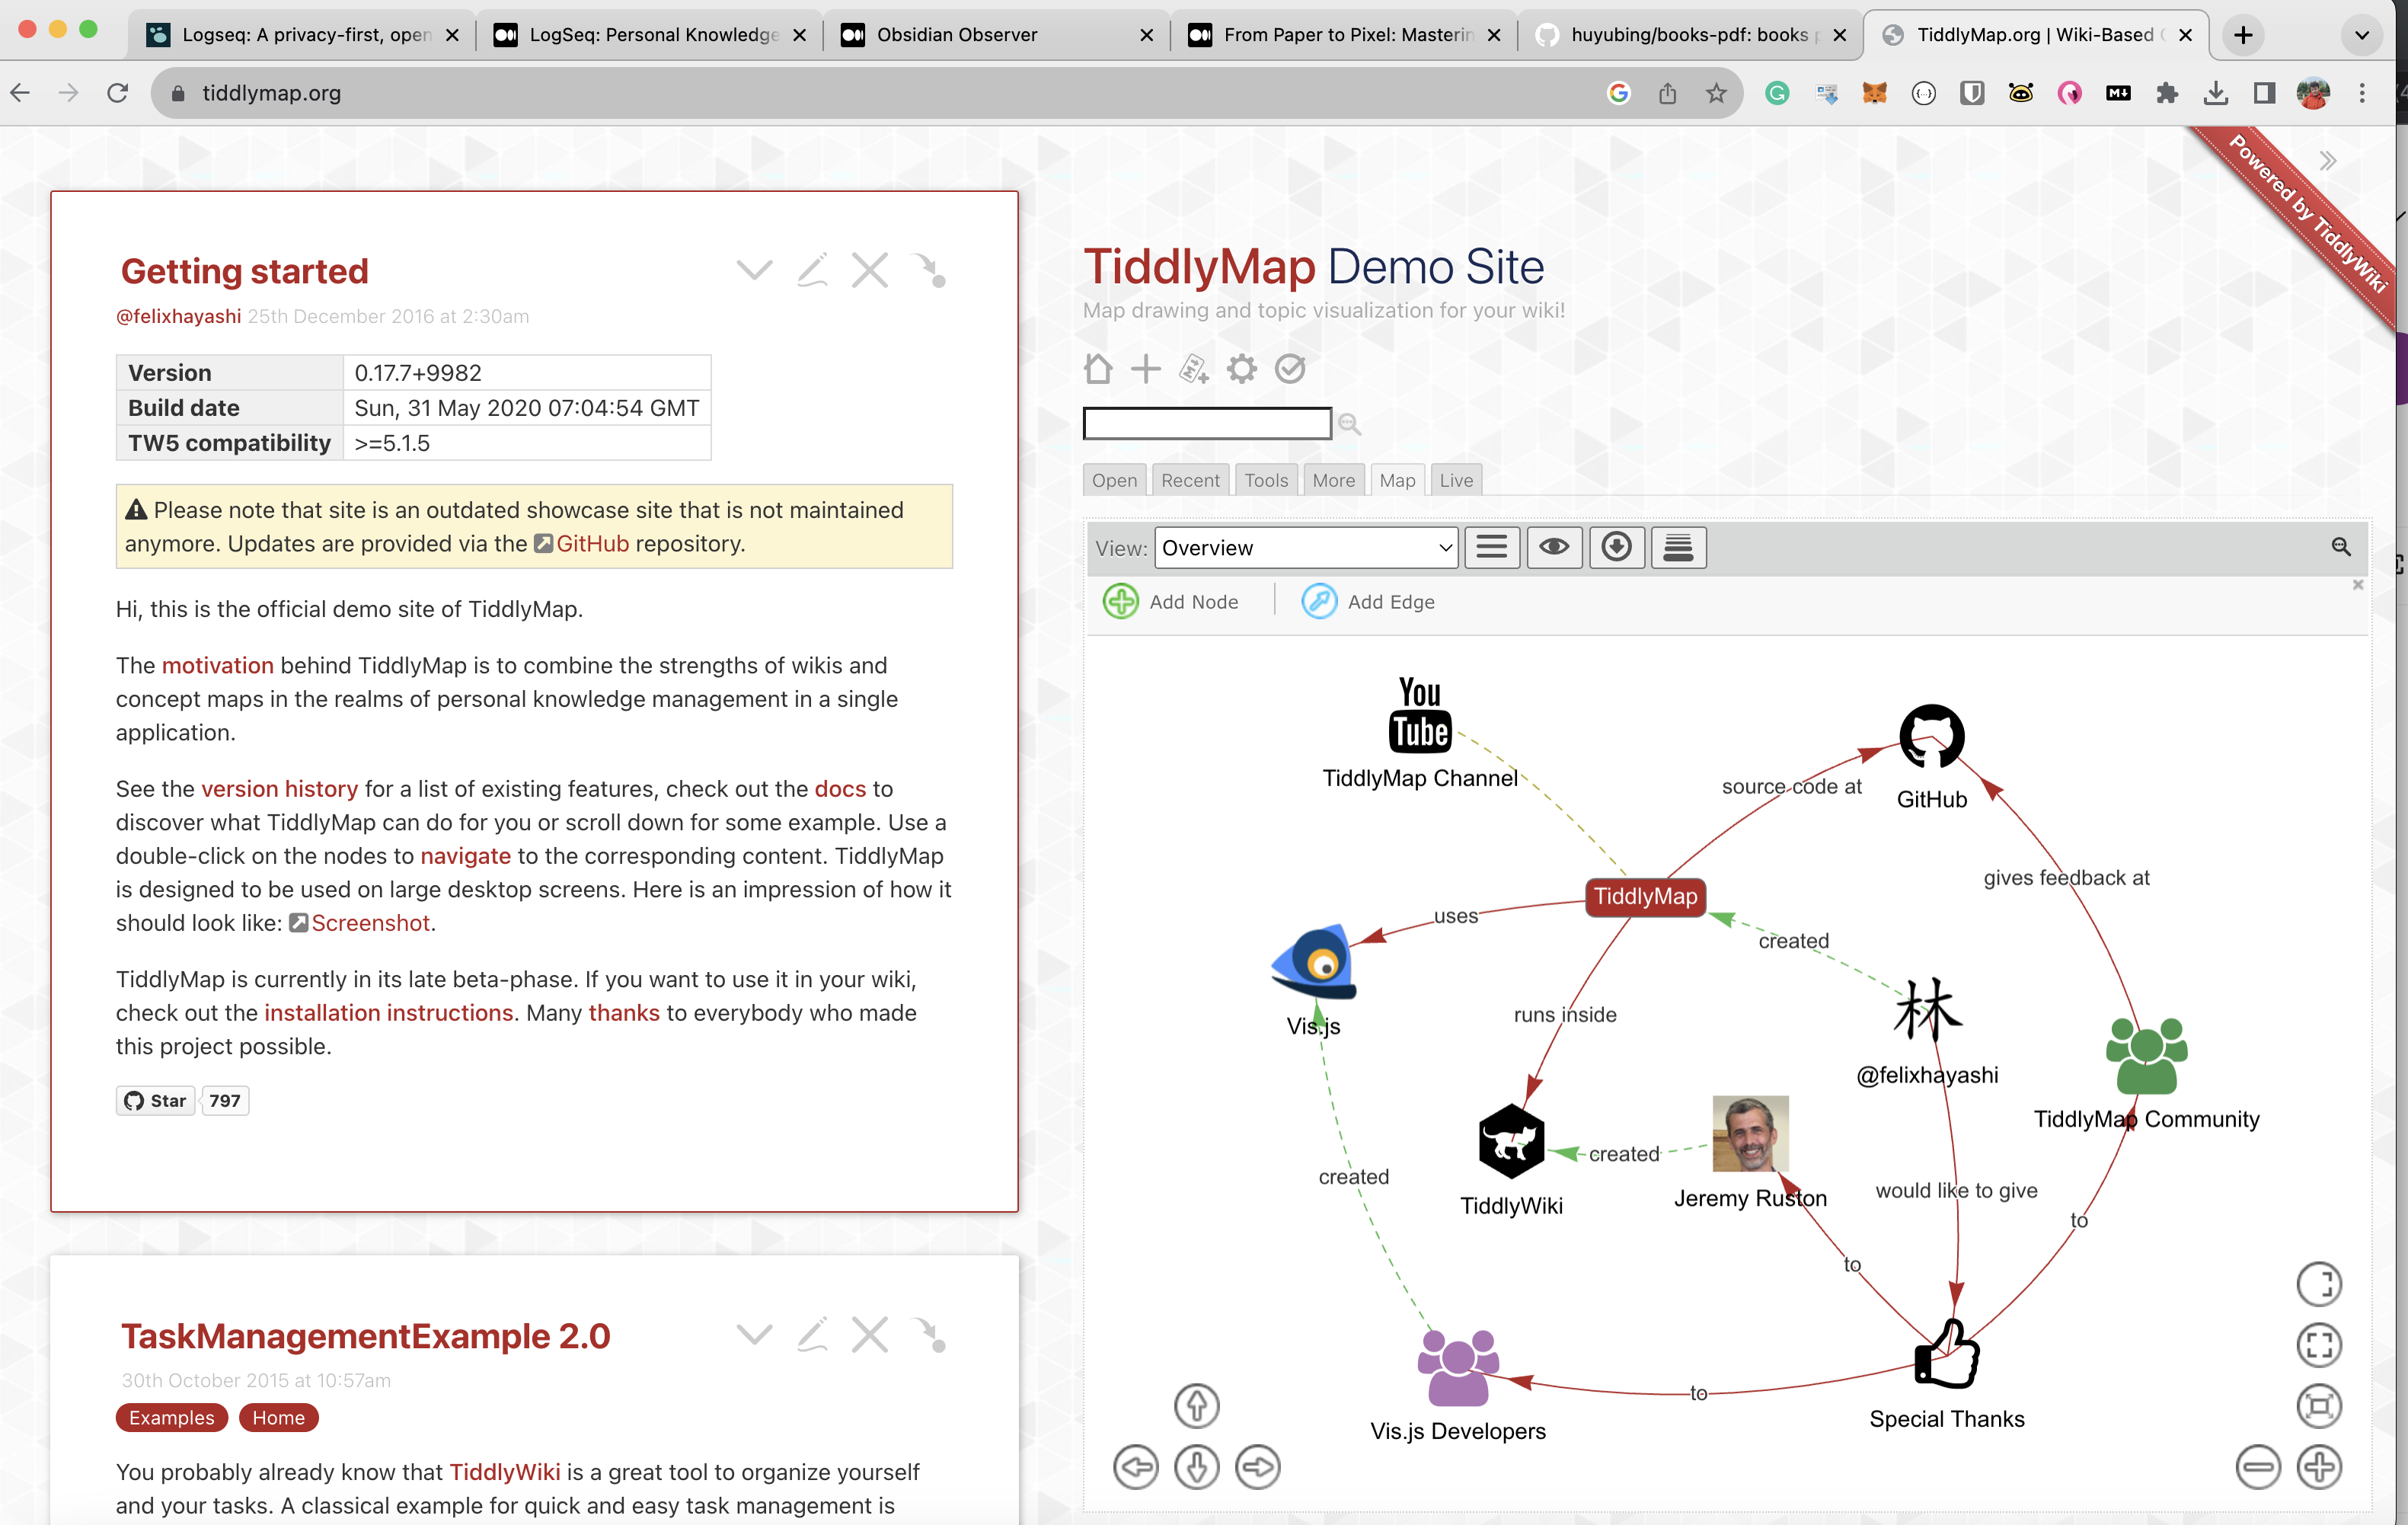
TiddlyMap is a plugin for TiddlyWiki that allows you to create, edit, and view graphs based on your tiddlers. It provides a graphical interface to visualize the relationships between your notes, making it easier to see connections and discover new insights.
Why Add TiddlyMap to TiddlyWiki?
Visual Learning: For those who are visual learners, TiddlyMap provides an intuitive way to understand complex information. Complex Relationships: It allows you to map out intricate relationships between tiddlers, which is particularly useful for projects that require a deep understanding of interconnected elements. Data Analysis: The graph view can serve as a tool for data analysis, helping you identify patterns or anomalies in your information. How Does It Work? Installation: TiddlyMap can be easily installed as a plugin from within TiddlyWiki. Creating Graphs: Once installed, you can create graphs by tagging tiddlers and defining relationships between them. Navigation: The graph view allows you to navigate between tiddlers by clicking on the nodes, making it a dynamic way to explore your content.


Write a comment