Fed Rate Cut Boosts Bitcoin Price Ahead of Q4 Melt-Up
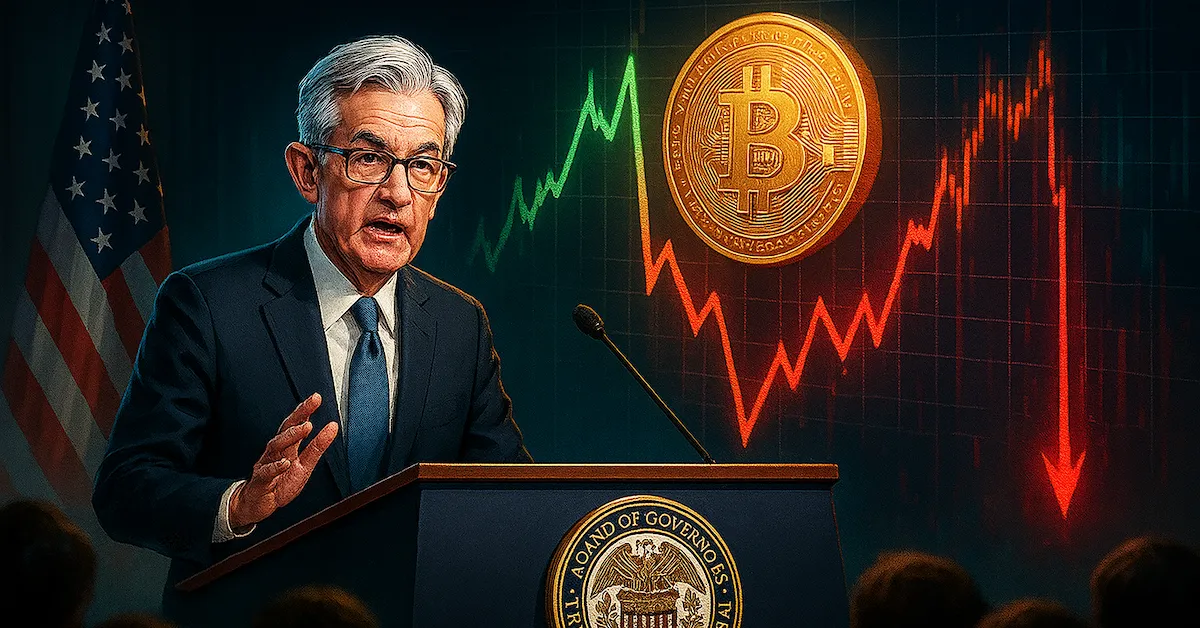
Bitcoin Magazine Fed Rate Cut Boosts Bitcoin Price Ahead of Q4 Melt-Up Historically, bitcoin’s price peaks approximately 20 months after a Bitcoin halving. The last Bitcoin halving occurred in April 2024, which means we could see a cycle top by December of this year. The odds of this are increasingly likely as Fed Chair Powell cut rates by 25 bps today, giving the approximately $7.4 trillion sitting in money market funds a reason to come off the sidelines and move into a hard asset like bitcoin, especially now that it’s easier to obtain exposure to bitcoin via spot bitcoin ETFs and proxies like bitcoin treasury companies. Powell also signaled today that two more rate cuts could be on the way before the year is out, which would only further reduce returns in money market funds, potentially pushing investors into hard assets like bitcoin and gold as well as riskier assets like tech and AI-related stocks. This could catalyze the final leg of a “melt-up” comparable to what we saw with tech stocks at the end of 1999 before the dot com bubble burst. In 1998, the Fed slashed rates by 75 basis points, igniting the dot-com bubble. Now the Fed is preparing to cut rates by at least 75 basis points over the next few months and may be making the same mistake with the AI bubble. Learn more:https://t.co/F9WZFQcABp$SPY $QQQ pic.twitter.com/r5yMoeycMX — Jesse Colombo (@TheBubbleBubble) September 16, 2025 Also, much like the likes of Henrik Zeberg and David Hunter, I believe the stage is being set for the final parabolic leg of a bull run that began in late 2022. As I said in 2022…. (when everybody was Bearish). The BlowOffTop would begin….. THIS IS IT! IT IS DEVELOPING RIGHT NOW! pic.twitter.com/bRERaWjf8T — Henrik Zeberg (@HenrikZeberg) September 17, 2025 Using a traditional financial index as a reference point, Zeberg sees the S&P 500 exceeding 7,000 before the year is out, while Hunter sees it rising to 8,000 (or higher) within the same time frame. @DaveHcontrarian forecast the S&P to 6000 at the end of 2022, when many other investors were predicting 2000. Now he has raised his target further to 8000, seeing more upside before the economy faulters later in the year. pic.twitter.com/oclBwqrh0L — Anthony (@AnthonyFatseas) July 2, 2025 What is more, we may be witnessing the breakdown of a 14-year support level for the US dollar, according to Macro Strategist Octavio (Tavi) Costa, which means we could see a markedly weaker dollar in the coming months, something else that would support the bull case for hard and risk assets. This move has profound implications in my view. The DXY index appears to be breaking down from a 14-year support level. If confirmed, it could signal the start of a sustained downward trend in the US dollar, in my view. Don’t underestimate the importance of major technical… pic.twitter.com/aFScjjXS8b — Otavio (Tavi) Costa (@TaviCosta) September 16, 2025 What Happens Come 2026? Both Zeberg and Hunter believe that, as of early next year, we’ll see the largest bust across all markets that we’ve seen since October 1929, when financial markets in the US collapsed, spurring the onset of the Great Depression. Zeberg’s rationale for this includes the real economy grinding to a halt, in part evidenced by the amount of homes on the market. Remember – there are analysts telling us that this is Early Cycle…..? We are heading right into the worst Recession SINCE 1930s. BlowOffTop still developing – but we can see an end to it! https://t.co/uZkTnYk9WT — Henrik Zeberg (@HenrikZeberg) September 17, 2025 Hunter believes that we’re at the end of a half century long secular debt-fueled cycle that will end with a leverage unwind unlike anything we’ve seen in modern history, as per what he shared on Coin Stories. Other signals like loan payment delinquencies also point to the idea that the real economy is screeching to a halt, which will inevitably have an effect on the financial economy. Student loans 90+ days delinquent have exploded higher to heights never seen before. https://t.co/sk8T9W07fb pic.twitter.com/BjFe6xPH9Q — Financelot (@FinanceLancelot) September 5, 2025 The Bitcoin Downturn Isn’t Guaranteed, but It’s Likely Even if we aren’t headed toward a global macro bust, bitcoin’s price will take a hit in 2026 if history repeats itself. That is, bitcoin’s price dropped from almost $69,000 at the end of 2021 to approximately $15,500 by the end of 2022 and from almost $20,000 at the end of 2017 to just over $3,000 at the end of 2018. In both cases, bitcoin’s price either tapped or dipped below its 200-week standard moving average (SMA), the light blue line on the charts below. Currently, bitcoin’s 200-week SMA is sitting at about $52,000. If we see a parabolic rise in bitcoin’s price in the coming months, it could rise as high as $65,000, before bitcoin’s price drops to such a price point or lower some time in 2026. If we do see the type of bust that Zeberg and Hunter are forecasting, bitcoin’s price could also drop well below that threshold. With all of that said, no one knows what the future holds, and please don’t interpret anything in this article as financial advice. At the same time, you may want to keep in mind that while history doesn’t necessarily repeat itself, it often rhymes. This post Fed Rate Cut Boosts Bitcoin Price Ahead of Q4 Melt-Up first appeared on Bitcoin Magazine and is written by Frank Corva.