Ch 15 - People and Organizations: Data Modeling is a Full-Contact Sport
Here is Chapter 15, which combines various articles on PDM about people, organizations, and data modeling. If I am going to pick one chapter to give to anyone working with data, this is it. I’ve seen more projects torpedoed by ignoring the advice in this chapter.
You might be wondering what Chapter 14 is. It has over a dozen images, and I need to work diligently on the artwork, which simply takes time. I expect it will be done sometime later this week or early next week. In the meantime, you can read this chapter as well as Chapter 16, which will be dropping this week as well. I’m also starting to format the book, so the finish line is getting closer. As of now, I’m targeting June for the book’s publication. The only thing that might get in the way of this timeline is my extensive international speaking tour, now through late May. Travel is rough, and I’m currently nursing terrible jet lag from my two-week trip to Asia 🤕. But the hard work is done, and I plan to format and ready the book for publication while on the road.
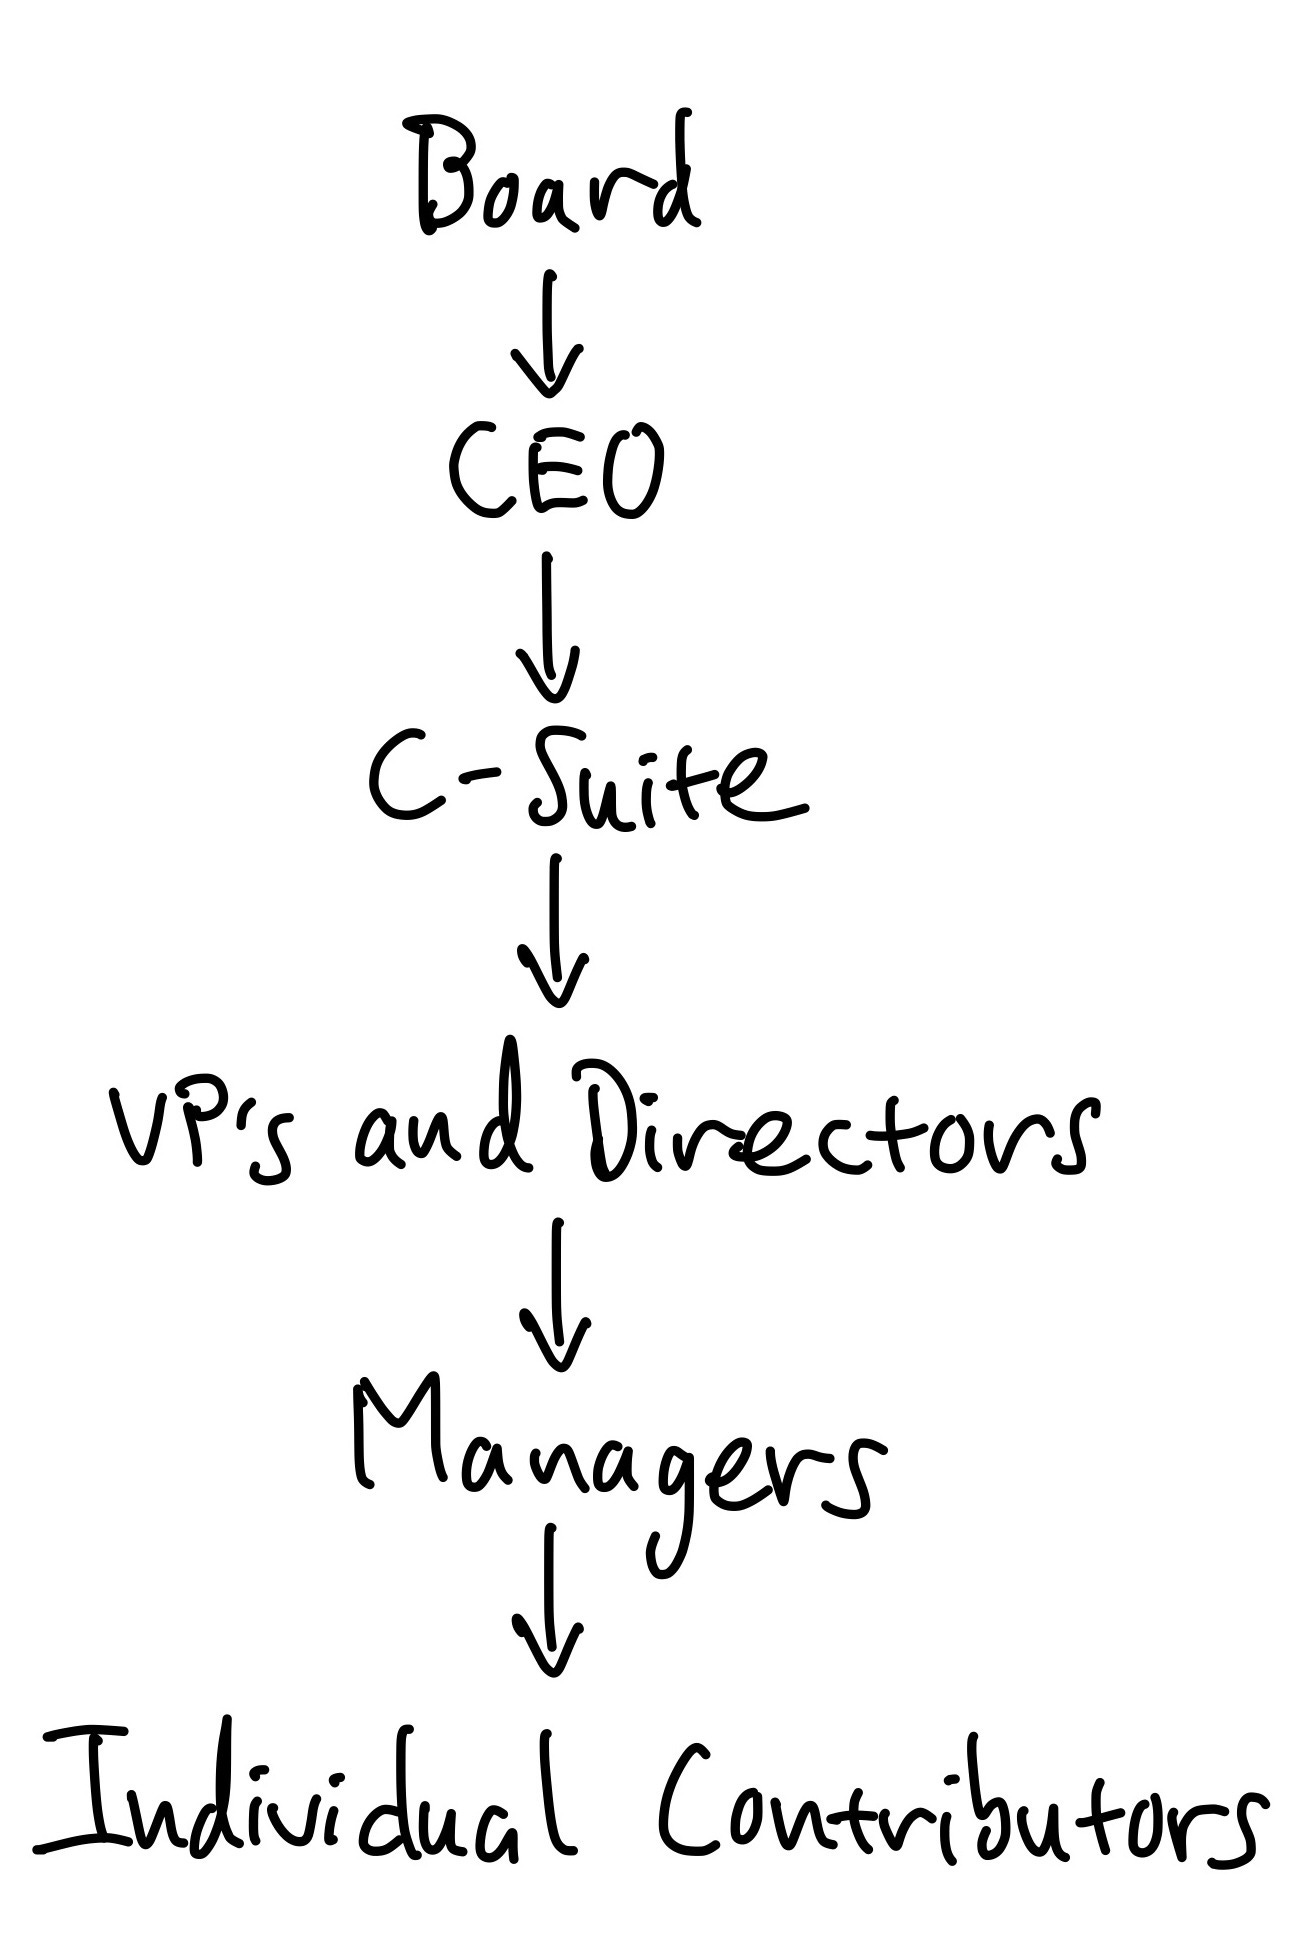
Thanks, Joe “The major problems of our work are not so much technological as sociological in nature.” — Tom DeMarco and Timothy Lister, Peopleware Anyone who’s trained at any gym long enough knows gym politics. Training partners become rivals for the same opportunity. Coaches get pulled in different directions. People leave for another gym and reinvent themselves, or they stay out of loyalty and stagnate. Gym owners have drama with each other and staff. The relationships in the gym shape your development as much as the training itself—who you roll with, who pushes you, who holds you back. Almost every gym I’ve trained at over the decades—combat sports or otherwise—seems to have some sort of gym politics or drama. Back to data modeling. Not much has changed since the 1980s when Peopleware was first published, and that quote is still as relevant as ever. The story of data modeling cannot be told without understanding how people interact within organizations. Work is a highly sociological phenomenon, yet for some reason, it is conspicuously absent from most data modeling resources. In my own experience, I’ve seen countless tech and data initiatives succeed or fail based not on the technical acumen of the practitioners but on the organizational dynamics surrounding them. The classic trap many practitioners fall into is believing their technical expertise will exempt them from interacting with “the business” or shield them from the whims and decisions of the broader organization. It’s happened to me many times, thinking my smarts and skills were enough. I’ve learned the hard way that many data initiatives, particularly data modeling, which can be very time-consuming, are at risk because people lack the situational awareness and organizational willpower needed to accomplish their goals. I believe this is one of the most pivotal chapters in the book, and ignoring it will likely lead to failure in your data modeling journey. A discussion of data modeling is incomplete without discussing its impact on people, organizations, and architecture. In the spectrum of people, process, and technology, people are paramount. You can be as technical as you wish, but understanding how to navigate organizations and models alongside your organization’s architecture is crucial to success. In my experience, people and organizational issues sink more IT projects, data modeling or otherwise, than anything else. Let’s look at one infamous example. Target Canada’s $7 Billion FailureA classic case study of organizational problems disguised as technical ones is the spectacular dumpster fire of Target Canada’s failed expansion in the early 2010s. Target operated conservatively and methodically in the United States. Then Target decided to expand into Canada. In the case of Target Canada, they chose a big-bang market entry, opening well over 100 stores in a single year on brand-new systems, with new teams and new suppliers, and with no local operating history. The reason? In 2011, Target purchased the leasehold rights of defunct Canadian retailer Zellers for $1.8 billion. Unfortunately for Target, the lease deal set demanding, compressed timelines to open three new distribution centers and convert the stores into Target Canada stores, all in less than 2 years. Never mind that constructing one distribution center often takes around two or more years. That aggressive, real estate-driven timeline became the de facto project manager. New people were severely undertrained and worked under immense time pressures. In the rush, the item master—the backbone of retail data—was hastily and inaccurately populated, with inconsistent units, packaging hierarchies, and identifiers that didn’t match those on the pallets. It only got worse. Shoppers received advertisements for products that weren’t in store inventory, even though distribution centers were overstocked with assortments that didn’t match local demand. Underneath this chaos sat a dysfunctional tangle of organizational dynamics. Junior staff who lacked the authority to push back on bad data often handled supplier onboarding. Validations that should have blocked flawed SKUs were treated as speed bumps rather than gates. Replenishment forecasting tools went live without the historical data they require to behave sensibly. Because it was Target, the forecast was as naive as “Whatever Zellers sold, just double it.” Different groups optimized for various goals: merchants for launch count, supply chain for flow, and stores for in-stock metrics. Predictably, people found ways to bypass controls to make their particular numbers look better. None of this can be blamed on data or software failure. Misaligned ownership, incentives, and sequencing produced systemic data defects. For data modelers, the lesson is not “pick a better tool.” Instead, it’s “design the social contract around the data model.” In Target Canada’s case, hindsight suggests treating the item master as a governed interface, not a disposable spreadsheet, where canonical units, packaging levels (each/inner/case/pallet), price zones and currencies, and required fields are enforced at write-time. Instead of using lease dates as the go-live date, ensure your data is production-ready by setting explicit quality bars for your highest-velocity SKUs and conducting end-to-end scans that reconcile physical labels with digital records. Give named business owners real accountability and the power to control data quality and modeling. And if your forecasting and inventory planning systems need historical data, start small and prudently so you can build it correctly. One bad decision or one bad table didn’t cause Target Canada’s downfall. Instead, failure emerged when organizational and power structures, misaligned incentives, and speed collided with fragile data foundations. That’s the core theme of this chapter. Data models live inside organizations, and when the organization is misaligned, the data will tell you first in your apps, dashboards, or AI models, and then in reality. A Closer-to-Home Failure: The Customer 360 ProjectTarget Canada is dramatic, but organizational failures happen at every scale. A friend joined a mid-sized company six months into their “Customer 360” initiative—a project to create a unified view of customers across Sales, Marketing, and Support. The technical approach was sound: consolidate customer data from Salesforce, Marketo, and Zendesk into a single warehouse. Given what you just read, you shouldn’t be shocked that what killed the project wasn’t technology. It was that Sales and Marketing couldn’t agree on what a “customer” meant. Sales counted only closed-won accounts. Marketing counted anyone who’d filled out a form. Support counted anyone with a ticket. Each department’s bonus structure depended on its definition, and no one had the authority to override it. The data modeling team spent eight months in meetings trying to negotiate a unified definition while the project budget drained away. The project was eventually canceled. Not because the data model was wrong, but because no one had secured executive alignment on definitions before starting the technical work. The data team became the scapegoat for “failing to deliver,” but the real failure was organizational: starting the “how” before resolving the “who” and “why.” My friend learned to never begin modeling without first documenting who owns the definitions and who has the authority to resolve disputes. Theory vs. the Real World“In theory, there’s no difference between practice and theory, but in practice, there is…” — Yogi Berra The organizational aspects of data modeling are often overlooked in the books and articles I’ve read. They instead teach technical data modeling tactics, assuming it happens in a vacuum. It’s like learning to box by watching instructional videos and hitting a punching bag. You’re learning movement, but you’re not getting punched in the face and developing real-world boxing awareness. Sadly, most data modeling efforts stall or fail because the real-world organizational aspects are ignored. Data modeling is a full-contact sport. Of course, you’ll need to build or maintain a data model. But your job is much more than that. Your job will be a mix of practitioner, salesperson, and servant. But before you get to data modeling, there are often roadblocks. People need to understand why they should invest in data modeling, why they should collaborate with you on this initiative, and what matters to them. Especially in today’s organizations, people are pressed for time and budget. Most people are overworked and have little patience. Unless you can show them why they need to pay attention to data modeling and what’s in it for them, your progress will be stalled. Data modeling theory paints a picture of a sterile, top-down exercise within a neat, orderly organization. Ideas and concepts are clearly understood, articulated, and always in sync. Data modeling is as simple as bringing people together for a series of workshops where they dispense everything you need, and you trot off to create the perfect data model. The reality is far messier. Let’s briefly look at some places where data modeling theory often gets a reality check: Ivory Tower Modeling. Data modeling is prescribed as a top-down exercise of gathering requirements from eager stakeholders, understanding every domain, and designing a pristine data model. What usually happens is you’re reverse-engineering some arcane, undocumented system, trying to decipher poor-quality data, and modeling under deadline pressure with incomplete information. Business rules are fuzzy and often undocumented. Stakeholders contradict each other. Requirements shift halfway through the project. For example, I once spent three weeks modeling an “order” entity only to discover that “order” meant something completely different in the warehouse system (a pick list) than in the e-commerce system (a customer transaction). Nobody told me because nobody realized they were using the same word for different things. Every data model is a political artifact. It reflects who has influence, what gets prioritized, and what gets ignored. These political dynamics are influenced by factors such as team communication, company strategy, technical debt, internal politics, and even personal relationships or vendettas. The Marketing VP who champions the new attribution model will fight to keep their preferred definition of “conversion” even when it’s demonstrably inconsistent with reality, because their bonus depends on it. One-size fits all. All too often, data modelers want to use their pet approach for every situation, regardless of whether it’s a good fit. Instead of viewing a data model as a singular approach, understand how different models serve diverse needs within an organization. This is the essence of Mixed Model Arts. A star schema that works beautifully for BI dashboards may be entirely wrong for a real-time recommendation engine. The data modeler who insists on a single approach for both will fail at one or the other. Constraints and compromises are normal. Every situation is different and has its constraints. You might choose a textbook-level data modeling approach that, if implemented, would take several years to complete. Then, you realize that due to time, budget, or resource constraints, you’ll need to make compromises and take shortcuts. The “right” way to model your product catalog might require a 9-month normalization effort. The business needs results in 3 months. You’ll need to accept some denormalization now and plan to refactor later—if “later” ever comes. Focusing only on tools and technology. The temptation is to reach for the closest tool and start building. The fixation on tools might distract from talking with people, understanding their world, and building a data model that works for them. A primary goal of data modeling is to achieve a shared understanding of the data within the organization. Especially for non-technical individuals, discussions about technology can be a significant distraction and turnoff. I’ve watched data engineers spend weeks evaluating whether to use dbt or regular SQL, while the actual stakeholders couldn’t even agree on what “revenue” meant. The choice of tool was irrelevant; the conceptual alignment was everything. As you can see, data modeling relies on situational and social awareness, not just knowledge of a particular modeling approach or tool. Which camp’s approach prevails in your organization often has less to do with technical merit and more to do with who’s in the room. If the BI team holds political power, you’ll build star schemas. If the engineering VP drives architecture decisions, you’ll get event streams. If a data governance committee controls standards, you’ll see normalization. The Mixed Model Artist recognizes that organizational dynamics determine modeling choices as much as technical requirements do. This chapter is about understanding those dynamics so you can navigate them. The Gravity of Conway’s Law“…organizations which design systems (in the broad sense used here) are constrained to produce designs which are copies of the communication structures of these organizations.” — Melvin Conway In 1968, when computing meant giant mainframes and punch cards, Melvin Conway published a paper called “How Do Committees Invent?” He couldn’t have known it then, but his central observation would become a foundational law for technology and system design, eventually bearing his name: Conway’s Law. Conway’s Law states that organizations design systems that mirror their communication structure. Here, the org chart is “shipped” to the systems and architectures within the organization. The systems and data a company creates will reflect how its teams are organized and how they communicate. If the company is centralized and top-down, this creates hierarchical, siloed communication and systems. By contrast, a flat, decentralized organization will support less rigid, more open communication patterns. The Silo TaxConway’s Law allows you to “see” how departments and business units interact. This will impact the type of data model you’ll build. Are departments such as Marketing, Sales, and Operations siloed from one another? When departments or teams operate independently with limited communication, they often develop their own data models and systems, creating data silos. This isn’t just a technical inconvenience. It’s a direct tax on organizational agility. Every redundant or inconsistent piece of data slows down decision-making, creates data interoperability nightmares, hinders innovation, and erodes trust in the data itself. Fragmented data models abound, hindering everything from ML model training to executive reporting and slowing the organization’s ability to act on data. Conway’s Law also affects how technology teams interact with each other. If your organization has separate teams for front-end, back-end, and database development, your software is likely to have distinct components with rigid boundaries that reflect these divisions. Likewise, if software, data, and AI/ML are separate teams, these groups will interact accordingly. This friction is a primary source of accidental complexity and technical debt. If data ownership is strictly aligned with team boundaries, it can create barriers to data access and sharing. Teams may be reluctant to share their data or may impose restrictions on its use. Are Silos Always a Bad Thing?Conventional wisdom says silos are bad. We’ve all seen the consequences of poorly managed silos—communication breakdowns, kingdom-building, bureaucracy, and corporate ossification. But silos don’t just appear out of thin air. They’re often a natural byproduct of growth and specialization. There might be deep expertise within a group that naturally creates separation of concerns. You want this separation, as it establishes clear accountability and ownership. Silos are fractal. Within IT, there might be sub-silos of engineering, data, and help desk. Each sub-silo has a sense of identity and cohesion. When silos work well, these domains collaborate. Silos become dangerous when they become rigid, isolated, and protectionist. In data, this manifests in many ways, such as arguing over metrics and meaning, data hoarding, or data being weaponized against other departments. A big part of data modeling is corralling people from various silos in the (often feeble) attempt to derive a shared understanding of vocabulary and concepts across the organization. Instead of viewing silos as a negative, embrace the silo for what it is—a way to bring people together around what they’re good at. Your data model can be one of the most powerful tools for bridging silos, creating a shared language that different experts can view together and agree on where they are and where they need to go. A Note on Silo ConsolidationHaving “too many” silos can result in more time spent on tracking than on completing interdependent tasks. Some departments that have been operating together for many years could be consolidated. The key insight here is that silo consolidation is often more practical than relying solely on technology-driven updates. Often, the organizational structure needs to change before the data architecture can improve. For example, I once worked with a company where the Finance and Accounting departments had operated as separate silos for over a decade, each maintaining its own chart of accounts and reporting cadence. Consolidating them into a single financial reporting unit—with a shared data model and unified definitions—eliminated months of quarterly reconciliation work and reduced reporting errors by more than half. The technology to merge their data had existed for years; what changed was the organizational decision to merge the teams. The data model followed the org chart, just as Conway’s Law predicts. The Inverse Conway ManeuverRecognizing the gravitational effect of Conway’s Law, some organizations use the “Inverse Conway Maneuver.” This means intentionally designing their team structure to achieve a desired system architecture. For example, if they want a modular, loosely coupled system, they might create small, autonomous teams responsible for specific modular components. This is the core principle that enables modern practices, such as microservice architectures or Data Mesh, in which teams are given ownership of a discrete business capability. In an ideal world, strive for cross-functional teams comprising representatives from various departments to promote collaboration and create a unified data landscape. Foster a culture of open communication and collaboration to encourage data sharing and knowledge transfer. Above all, burn Conway’s Law into your brain and use it every time you look at your organization’s structure. Organizational Archetypes & Their ImpactJust as different gyms offer different levels of support to their fighters, you need to be aware of how your organization is structured. The organization’s structure shapes how it behaves and communicates. Before diving in, a caveat: these are generalizations. They won’t fully capture the nuances of your specific situation. Instead, use them as broad outlines. And a practical reality check: when data modeling, you need organizational and situational awareness. This means being honest about your ability (or lack thereof) to effect change. Often, you’ll inherit the org chart with little to no power to change it. The org chart represents the contours (and force field) within which you’ll operate. Traditional Hierarchies: The “Data Breadline”In a traditional hierarchy, there’s a clear, formal chain of command from the top down, much like a pyramid. This structure often involves significant bureaucracy, characterized by rigid procedures, multiple layers of approval, and a strong emphasis on adherence to established protocols. • • Figure 15.1: A traditional top-down hierarchyThere are two orthogonal silos in a traditional hierarchy. First, there are silos between layers: C-Levels talk with other C-Levels, VPs meet with their peers, and ICs talk among themselves. Second, there’s the departmental silo, where sales, marketing, operations, and other departments are typically self-contained and segregated. Conway’s Law suggests that these departmental silos foster communication styles and vocabularies unique to each silo. This works well for the silo, but makes it incredibly challenging to create a shared understanding across departments. A classic manifestation: a central data team residing within IT, modeling a centralized data warehouse, handling inbound data requests from every department. This team is tasked with creating a single, unified Enterprise Data Model. They interview stakeholders across every department, negotiate standard definitions, and build a canonical model. In practice, these efforts are extremely slow, expensive, and high-risk. Debates over definitions can take months or years. The central team becomes a bottleneck, creating “data breadlines” that slow every department’s access to data. • • Figure 15.2: A central data teamWhat this means for your modeling approach: If you’re in a traditional hierarchy, accept that you won’t move fast. Focus your energy on time-boxing discovery work, making visible wins, building and iterating with an agile approach, and getting decisions rather than just status updates. Think of it like fighting in deep water—every movement costs more energy, so make each one count.
          Read more
       (https://practicaldatamodeling.substack.com/p/ch-15-people-and-organizations-data)
Write a comment